
My previous blog post discussed the racial and ethnic diversity of graduate students in U.S. urban planning programs (see Are U.S. Planning Programs “Diverse”?). I received some very insightful feedback, mostly supporting the idea that we need to better define what “diversity” means if planning academics and planning professionals consider this a priority. I wasn’t accusing PAB of intentionally focusing on “whiteness” in their description of “student diversity,” rather, I was pointing out how diversity ends up being perceived relative to the racial/ethnic categories that are used to report student and faculty composition. The fact of the matter is that skin color dominates the “diversity” conversation.
The second part of my descriptive analysis of program racial/ethnic diversity focuses on faculty, as well as a comparison of faculty to students. It’s no surprise that faculty members of urban planning programs are predominantly white. Data from PAB’s Annual Report Online Database (AROD) show the breakdown of full-time, part-time, and adjunct faculty for planning programs.[1] Out of 1,806 total faculty, nearly 80% are white. This figure is composed of 71% white full-time faculty, 77% white part-time faculty, and 85% white adjunct faculty. Figure 1 illustrates a stark gender imbalance as well as the large numbers of white adjuncts hired by planning programs. The predominance of white adjuncts may be a reflection of the planning profession (i.e., the available pool) or who we choose to hire. While the proportions of white full-time faculty and graduate planning students are quite close (71% and 70% respectively), the gap widens with respect to part-time and adjunct faculty.
Figure 1
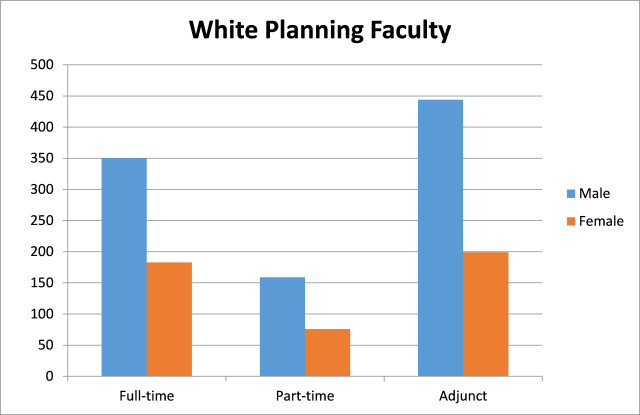
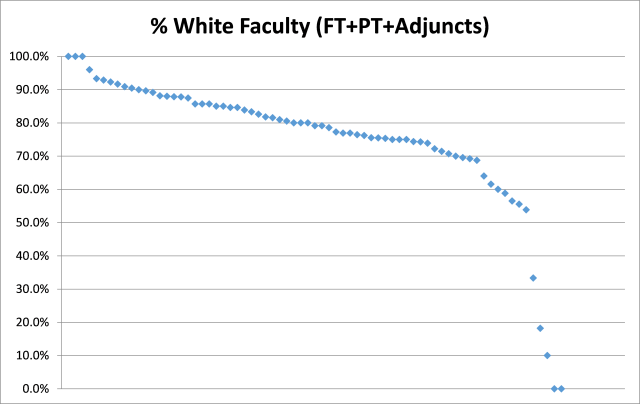
Figure 2 shows a relatively flat distribution with about half of planning programs having 80% or greater white faculty members and less than one-fifth having under 70% white faculty members.
Figure 2
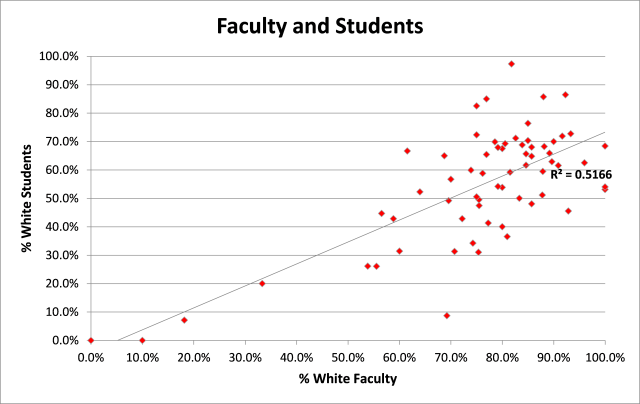
Comparing program proportions of white faculty and students shows a significant positive correlation between the two groups (see Figure 3). It would be interesting to assess the role of recruiting resources and other institutional factors that may be influencing this relationship. It would also be interesting to see how/if this relationship has changed over time.
Figure 3
As shown in the post on student racial and ethnic diversity, I also looked at the numbers of race/ethnicity categories represented by planning program faculty members. This is a crude measure of variation because it doesn’t account for the evenness of numbers between categories, however, it is used here for illustrative purposes. The numbers of categories are slightly different for the faculty data from the AROD and the data from the ACSP Guide. The AROD includes 9 race categories for faculty:
- White
- Black or African American
- American Indian or Alaska Native
- Asian
- Native Hawaiian and Other Pacific Islander
- Some Other Race Alone
- Two or More Races
- Unknown
- Foreign
The ACSP Guide includes 8 race/ethnicity categories for students:
- Hispanics of Any Race
- White
- African American
- Native American/Pacific Islander
- Asian American
- Mixed
- Other/Don’t Know
- Non-US Citizens
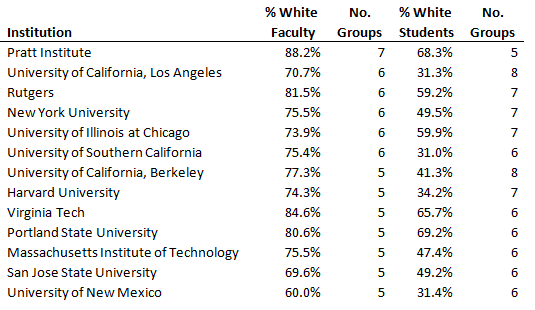
Figure 4 shows the relationship between the numbers of faculty and student categories represented by planning programs. Similar to Figure 3 there is an observable positive correlation between the numbers of groups represented by planning faculty and the students within programs. The upper right-hand corner highlights 13 “diverse” programs that have at least 5 groups represented by both faculty and students. Table 1 shows the list of these schools.
Figure 4
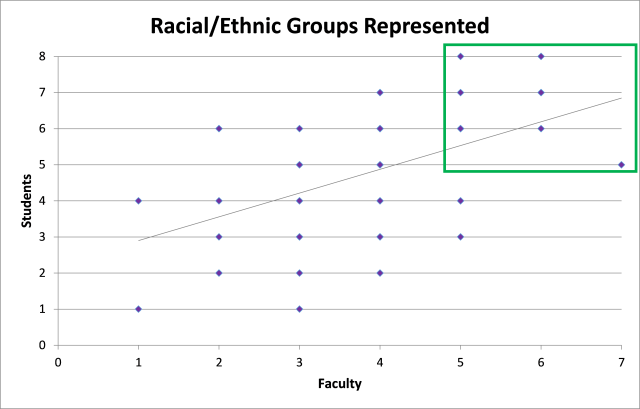
Table 1 – Racial/Ethnic categories represented by faculty and students
Your comments are appreciated.
[1] I combined these data with data from the ACSP Guide used in the student analysis. This resulted in complete data for 65 U.S. planning programs.
Additionally, several terms are often used within the context of diversity. It is important to note the meaning and potential application of these terms.