See our new open access article in the Journal of the American Planning Association on the ethics of AI in planning. Co-authors Marc Brenman, Xinyue Ye, and I welcome your comments. https://www.tandfonline.com/doi/full/10.1080/01944363.2024.2355305

See our new open access article in the Journal of the American Planning Association on the ethics of AI in planning. Co-authors Marc Brenman, Xinyue Ye, and I welcome your comments. https://www.tandfonline.com/doi/full/10.1080/01944363.2024.2355305
The updated citation data have just been posted at ScholarMetrics. Thanks to those of you who provided corrections, updates, and other faculty information. As mentioned before, there is no (easy) way to provide real-time updates due to Google Scholar limitations. I scrape Google Scholar Profiles for faculty who maintain them (about 800 of you) and then I use Harzing’s Publish or Perish to search publications and metrics for those who don’t have profiles (about 250). There is a lot of manual work involved so I’m only able to provide updates twice a year. Usually after I post updates I’ll receive several corrections which take a couple of weeks to clean up. A common question I get is about who is included. I try to only include active, full-time, tenure-track faculty because program comparisons are meant to reflect current faculty activities for assistant, associate, and full professors. This means adjuncts, retired, emeritus, lecturers, etc. are not included because the expectations for scholarly productivity are not the same as for current, tenure or tenure-track faculty. Links to previous years and more background are provided at Scholarmetrics. Please let me know if you have any comments or suggestions at: twsanchez@tamu.edu.
Figure 1. Top schools by median citations

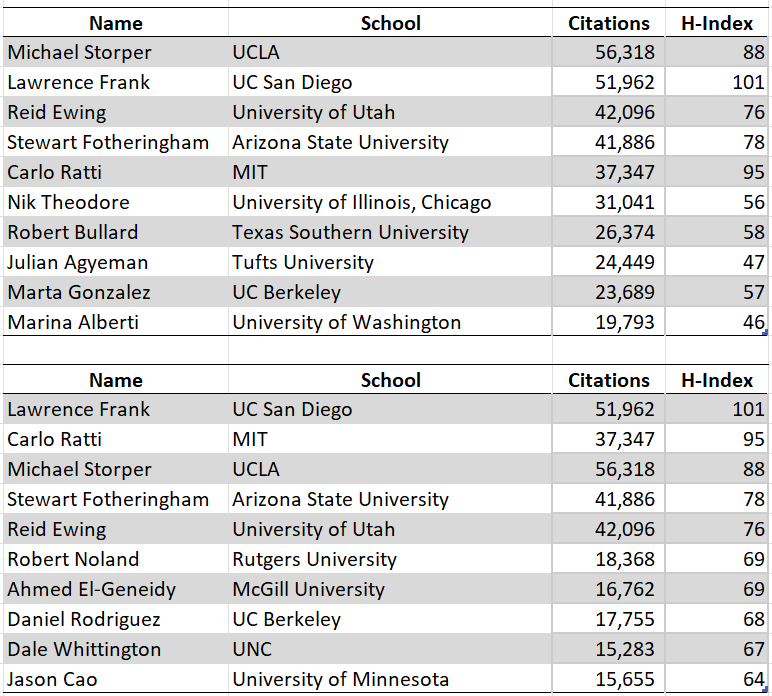
Figure 2. Top faculty by total citations and H-Index

Download the call for chapters here.
Special Issue “Big Data in Urban Land Use Planning” in Land.
https://www.mdpi.com/journal/land/special_issues/8947MIE392
With the development of urbanization and population growth, the problem of human–land conflict has become increasingly serious, and it is restricting the healthy and sustainable development of the urban landscape. Since the urban land use planning process is complex and involves social, economic, environmental, and political systems, knowledge of how these systems interact is the domain of professional planners. Advances in artificial intelligence (AI) and big data technology present planners with a ripe opportunity to critically assess their approaches and explore how new data collection, analysis, and methods can augment their understanding of places, as they seek to anticipate a future with an overall improved quality of life. Artificial intelligence (AI) and big data technology can offer access to more and enhanced information regarding travel patterns, energy consumption, land utilization, and environmental impacts, while also helping to better integrate these systems.
For this Special Issue, we invite you to submit original research articles and reviews that provide insights into big data and urban land use planning. Research areas may include (but are not limited to) the following:
The recently updated citation data have been posted at ScholarMetrics. Just over 76% of the faculty being tracked (802 out of 1,054) have Google Scholar Citation Profiles and the rest of the faculty included are updated manually. I greatly appreciate those of you who send updates and corrections. Please let me know if you have any suggestions at: twsanchez@tamu.edu.
All Schools (Total Faculty Citations)
| Planning School | Faculty | Median | Mean |
|---|---|---|---|
| The New School | 6 | 3,845 | 5,060 |
| USC | 15 | 3,501 | 4,573 |
| Arizona State University | 16 | 3,348 | 6,080 |
| MIT | 32 | 2,954 | 4,692 |
| UCLA | 28 | 2,862 | 6,031 |
| New York University | 7 | 2,722 | 3,495 |
| Georgia Tech | 15 | 2,460 | 2,776 |
| University of Toronto | 8 | 2,371 | 2,037 |
| University of Colorado, Denver | 6 | 2,359 | 3,010 |
| McGill University | 7 | 2,288 | 4,817 |
| University of Minnesota | 11 | 2,178 | 3,727 |
| UC Berkeley | 14 | 2,107 | 6,116 |
| University of British Columbia | 14 | 2,067 | 3,850 |
| Tufts University | 8 | 2,018 | 4,666 |
| Universite Laval | 13 | 1,994 | 2,394 |
| UNC | 17 | 1,889 | 4,645 |
| Rutgers University | 19 | 1,809 | 2,727 |
| University of Massachusetts-Amherst | 7 | 1,731 | 1,699 |
| University of Pennsylvania | 15 | 1,703 | 2,946 |
| University of Maryland | 10 | 1,682 | 2,386 |
| Virginia Tech | 12 | 1,665 | 2,523 |
| University of Michigan | 15 | 1,646 | 2,740 |
| University at Buffalo, The State University of New York | 12 | 1,622 | 1,848 |
| University of Delaware | 4 | 1,602 | 1,397 |
| Northeastern University | 10 | 1,580 | 1,467 |
| Harvard University | 9 | 1,524 | 3,378 |
| University of Waterloo, Ontario | 19 | 1,370 | 1,811 |
| Florida State University | 10 | 1,367 | 1,397 |
| Ohio State University | 14 | 1,330 | 1,431 |
| University of Saskatchewan | 5 | 1,314 | 1,086 |
| Queen’s University | 7 | 1,270 | 1,506 |
| University of South Florida | 4 | 1,259 | 1,216 |
| University of Iowa | 5 | 1,224 | 1,394 |
| University of Utah | 9 | 1,200 | 5,984 |
| Portland State University | 17 | 1,170 | 2,134 |
| Florida Atlantic University | 6 | 1,129 | 1,665 |
| University of Alberta | 14 | 1,121 | 2,624 |
| York University | 10 | 1,108 | 2,262 |
| Michigan State University | 9 | 1,096 | 1,263 |
| University of Washington | 13 | 1,095 | 3,654 |
| University of Illinois, Chicago | 17 | 1,086 | 2,958 |
| University of Oregon | 14 | 1,042 | 1,403 |
| San Diego State University | 4 | 1,035 | 1,153 |
| Temple University | 3 | 1,012 | 702 |
| University of Virginia | 10 | 979 | 2,742 |
| University of Louisville | 12 | 967 | 1,185 |
| University of Texas, Austin | 11 | 916 | 1,496 |
| University of Illinois, Urbana-Champaign | 11 | 900 | 1,802 |
| Cornell University | 18 | 867 | 2,004 |
| Simon Fraser University | 7 | 844 | 1,232 |
| UC Irvine | 21 | 815 | 2,950 |
| Texas Southern University | 8 | 811 | 4,004 |
| Texas A&M University | 24 | 807 | 2,339 |
| State University of New York at Albany | 4 | 799 | 1,596 |
| Northern Arizona University | 8 | 711 | 660 |
| San Jose State University | 11 | 675 | 1,061 |
| Hunter College | 8 | 618 | 780 |
| Rowan University | 4 | 610 | 637 |
| University of Texas, San Antonio | 4 | 583 | 562 |
| University of New Orleans | 6 | 570 | 596 |
| University of Hawaii | 8 | 569 | 1,020 |
| Cal Poly, San Luis Obispo | 8 | 551 | 902 |
| Clemson University | 5 | 536 | 755 |
| Cleveland State University | 7 | 535 | 859 |
| Miami University | 6 | 518 | 549 |
| University of Arizona | 7 | 517 | 457 |
| University of Wisconsin, Madison | 13 | 513 | 1,039 |
| University of Toledo | 9 | 496 | 1,472 |
| Wayne State University | 5 | 478 | 897 |
| University of Florida | 12 | 476 | 1,432 |
| University of Massachusetts-Boston | 11 | 468 | 1,143 |
| Virginia Commonwealth University | 9 | 468 | 507 |
| University of Guelph | 8 | 454 | 483 |
| University of Texas, Arlington | 6 | 452 | 1,073 |
| Dalhousie University | 6 | 451 | 563 |
| Morgan State University | 6 | 451 | 617 |
| Universite de Montreal | 12 | 432 | 1,181 |
| University of Memphis | 5 | 430 | 618 |
| University of Missouri-Kansas City | 4 | 411 | 1,007 |
| Iowa State University | 10 | 404 | 591 |
| UC San Diego | 11 | 395 | 5,340 |
| Alabama A&M University | 6 | 346 | 711 |
| University of Calgary | 8 | 337 | 975 |
| California State University, Northridge | 7 | 320 | 407 |
| University of Nebraska | 3 | 296 | 1,694 |
| University of Pittsburgh | 3 | 292 | 298 |
| University of Kansas | 4 | 272 | 534 |
| University of Manitoba | 6 | 265 | 883 |
| Eastern Washington | 3 | 255 | 296 |
| East Carolina University | 4 | 244 | 389 |
| University of New Mexico | 7 | 239 | 384 |
| University of Quebec in Montreal | 16 | 235 | 617 |
| University of Cincinnati | 12 | 225 | 818 |
| Columbia University | 6 | 221 | 2,721 |
| Western Washington University | 5 | 214 | 323 |
| New Jersey Institute of Technology | 7 | 197 | 594 |
| Auburn University | 5 | 189 | 278 |
| University of Oklahoma | 3 | 166 | 128 |
| Toronto Metropolitan University | 16 | 162 | 720 |
| Jackson State University | 6 | 142 | 538 |
| University of Wisconsin, Milwaukee | 3 | 130 | 1,065 |
| Minnesota State University, Mankato | 6 | 101 | 184 |
| Rutgers University, School of Environmental & Biological Sciences | 7 | 100 | 826 |
| West Chester University | 7 | 87 | 216 |
| Indiana University of Pennsylvania | 4 | 87 | 164 |
| Kansas State University | 4 | 87 | 114 |
| University of Georgia | 7 | 79 | 221 |
| Cal Poly, Pomona | 7 | 75 | 562 |
| Pratt Institute | 5 | 75 | 160 |
| Ball State University | 5 | 60 | 253 |
| Westfield State University | 8 | 28 | 332 |
| University of Puerto Rico | 6 | 11 | 107 |
| Appalachian State University | 2 | 676 | 676 |
| University of Northern British Columbia | 2 | 644 | 644 |
| University of Southern Maine | 2 | 484 | 484 |
| Missouri State University | 2 | 300 | 300 |
| Eastern Michigan University | 2 | 6 | 6 |
| Savannah State University | 1 | 275 | 275 |
| Salisbury University | 1 | 220 | 220 |
| Georgetown University | 1 | 51 | 51 |
The updated citation data are now available for Summer 2023. Citations are tracked for “regular” (i.e., tenure track) faculty in urban planning programs and departments in the U.S. and Canada. Nearly 75% of the faculty being tracked (790 out of 1,057) have Google Scholar Citation Profiles. See the ScholarMetrics page to look up individual faculty and planning program data. Figures 1 and 2 display citation and H-Index by rank with median number of citations for assistant, associate, and full professors is 197, 675, and 1,971 respectively. The median H-Index for assistant, associate, and full professors 6, 12, and 19 respectively. The data are available here in case you would like to do your own analyses. Please contact me if you have questions, comments, or corrections.
Figure 1
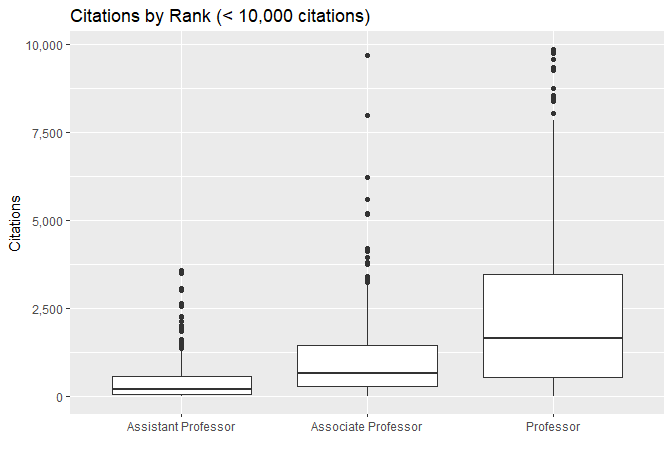
Figure 2
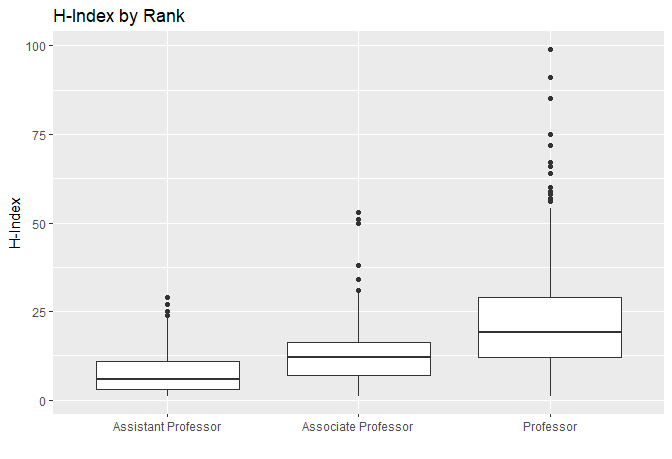
Figure 3 Total Citations
| Name | School | Citations | H-Index |
|---|---|---|---|
| Michael Storper | UCLA | 52,629 | 85 |
| Lawrence Frank | UC San Diego | 48,271 | 99 |
| Reid Ewing | University of Utah | 38,713 | 72 |
| Stewart Fotheringham | Arizona State University | 38,369 | 75 |
| Carlo Ratti | MIT | 32,703 | 91 |
| Martha Feldman | UC Irvine | 32,089 | 49 |
| Nik Theodore | University of Illinois, Chicago | 29,117 | 54 |
| Robert Bullard | Texas Southern University | 24,428 | 56 |
| Julian Agyeman | Tufts University | 23,012 | 47 |
| Marta Gonzalez | UC Berkeley | 21,828 | 51 |
Figure 4 H-Index
| Name | School | Citations | H-Index |
|---|---|---|---|
| Lawrence Frank | UC San Diego | 48,271 | 99 |
| Carlo Ratti | MIT | 32,703 | 91 |
| Michael Storper | UCLA | 52,629 | 85 |
| Stewart Fotheringham | Arizona State University | 38,369 | 75 |
| Reid Ewing | University of Utah | 38,713 | 72 |
| Ahmed El-Geneidy | McGill University | 14,786 | 67 |
| Robert Noland | Rutgers University | 17,046 | 66 |
| Daniel Rodriguez | UC Berkeley | 15,967 | 64 |
| Dale Whittington | UNC | 14,381 | 64 |
| Mindy Fullilove | The New School | 16,036 | 60 |
Figure 5 Schools
| School | Faculty | Median | Mean |
|---|---|---|---|
| The New School | 6 | 3,669 | 4,928 |
| USC | 15 | 3,426 | 4,442 |
| Arizona State University | 16 | 3,205 | 5,801 |
| UCLA | 27 | 2,804 | 5,978 |
| MIT | 32 | 2,768 | 4,504 |
| New York University | 7 | 2,625 | 3,411 |
| Georgia Tech | 15 | 2,306 | 2,668 |
| University of Maryland | 9 | 2,303 | 2,540 |
| University of Colorado, Denver | 6 | 2,249 | 2,897 |
| McGill University | 7 | 2,139 | 4,600 |
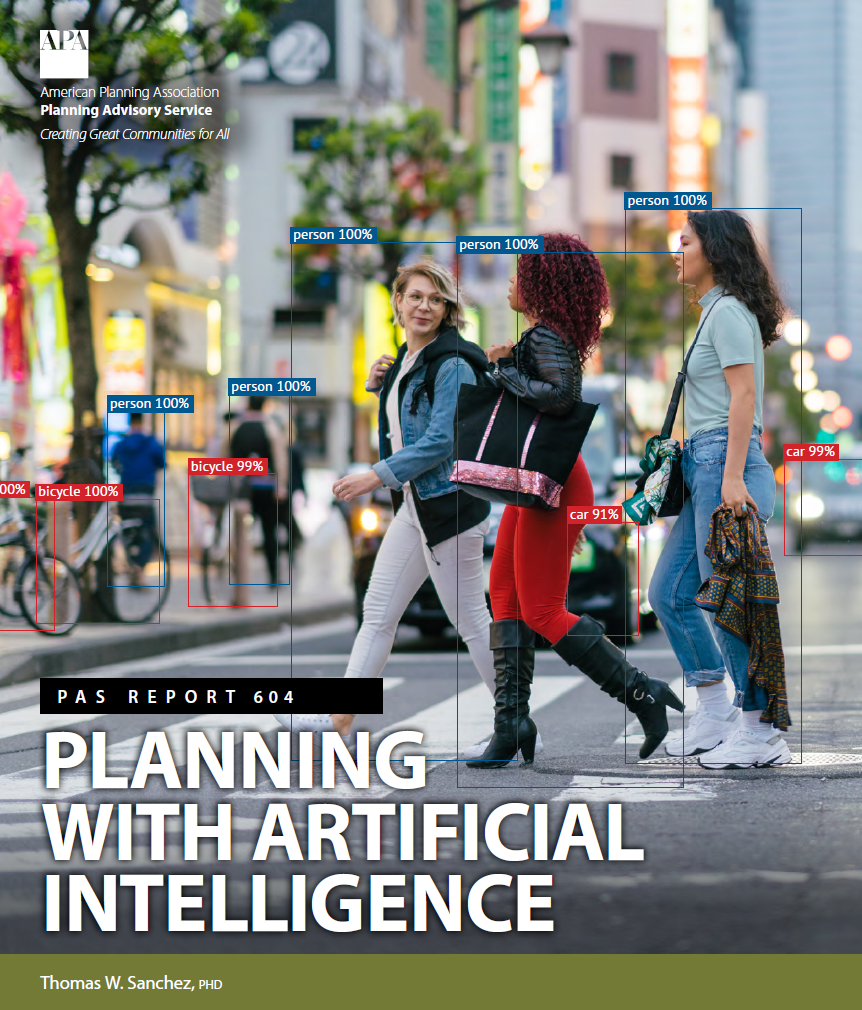
Artificial intelligence is a potentially transformative tool for the planning profession. This PAS Report introduces the knowledge and skills planners need to use appropriate AI methods in the service of creating more livable, resilient, and sustainable communities.
The new citation data are now available for Winter 2023. Citations are tracked for “regular” (i.e., tenure track) faculty in urban planning programs and departments in the U.S. and Canada. I am pleased to report that over 76% of the faculty being tracked (784 out of 1,039) now have Google Scholar Citation Profiles. See the ScholarMetrics page to look up individual faculty and planning program data.
Top 10 Faculty (Total Citations)
| Name | School | Citations | H-Index |
|---|---|---|---|
| Michael Storper | UCLA | 51,326 | 84 |
| Lawrence Frank | UC San Diego | 46,596 | 96 |
| Reid Ewing | University of Utah | 37,231 | 71 |
| Stewart Fotheringham | Arizona State University | 36,774 | 73 |
| AnnaLee Saxenian | UC Berkeley | 36,315 | 51 |
| Martha Feldman | UC Irvine | 31,168 | 48 |
| Carlo Ratti | MIT | 30,691 | 88 |
| Nik Theodore | University of Illinois, Chicago | 28,365 | 53 |
| Robert Bullard | Texas Southern University | 23,600 | 55 |
| Julian Agyeman | Tufts University | 22,035 | 46 |
Top 10 Faculty (H-Index)
| Name | School | Citations | H-Index |
|---|---|---|---|
| Lawrence Frank | UC San Diego | 46,596 | 96 |
| Carlo Ratti | MIT | 30,691 | 88 |
| Michael Storper | UCLA | 51,326 | 84 |
| Stewart Fotheringham | Arizona State University | 36,774 | 73 |
| Reid Ewing | University of Utah | 37,231 | 71 |
| Robert Noland | Rutgers University | 16,455 | 65 |
| Ahmed El-Geneidy | McGill University | 13,842 | 65 |
| Dale Whittington | UNC | 14,346 | 64 |
| Daniel Rodriguez | UC Berkeley | 15,173 | 63 |
| Jennifer Wolch | UC Berkeley | 20,365 | 62 |
Top 10 Urban Planning Programs (Median Citations)
| School | Faculty | Median | Mean |
|---|---|---|---|
| The New School | 6 | 3,479 | 4,804 |
| UC Berkeley | 17 | 3,363 | 8,723 |
| USC | 15 | 3,067 | 4,350 |
| Arizona State University | 16 | 3,047 | 5,490 |
| UCLA | 28 | 2,573 | 5,518 |
| UNC | 14 | 2,551 | 5,094 |
| New York University | 9 | 2,514 | 2,547 |
| University of Toronto | 11 | 2,440 | 1,976 |
| MIT | 32 | 2,415 | 4,272 |
| UC San Diego | 5 | 2,250 | 10,301 |
Please contact me with any corrections or questions, tom[dot]sanchez[at]vt[dot]edu.
AI in Planning: Opportunities and Challenges and How to Prepare – Conclusions and Recommendations from American Planning Association‘s “AI in Planning” Foresight Community https://www.planning.org/publications/document/9255930/
By Clinton Andrews, Keith Cooke, Alexsandra Gomez, Petra Hurtado, Thomas Sanchez, Sagar Shah, and Norman Wright

The new citation data are now available for Fall 2022. Citations are tracked for regular (tenure track) faculty in urban planning programs and departments in the U.S. and Canada. I am pleased to report that over 72% of the faculty being tracked (750 out of 1,037) now have Google Scholar Citation Profiles. See the ScholarMetrics page to look up individual faculty and/or planning program data.
Top 10 Faculty (Total Citations)
| Name | School | Citations | H-Index |
|---|---|---|---|
| Michael Storper | UCLA | 49,424 | 84 |
| Lawrence Frank | UC San Diego | 44,534 | 92 |
| AnnaLee Saxenian | UC Berkeley | 35,433 | 51 |
| Reid Ewing | University of Utah | 34,835 | 69 |
| Stewart Fotheringham | Arizona State University | 34,389 | 72 |
| Martha Feldman | UC Irvine | 29,859 | 48 |
| Carlo Ratti | MIT | 28,036 | 85 |
| Nik Theodore | University of Illinois, Chicago | 26,993 | 52 |
| Robert Bullard | Texas Southern University | 22,528 | 56 |
| Julian Agyeman | Tufts University | 20,743 | 45 |
Top 10 Urban Planning Programs (Median Citations)
| School | Faculty | Median | Mean |
|---|---|---|---|
| The New School | 6 | 3,235 | 4,578 |
| UC Berkeley | 17 | 3,038 | 8,295 |
| Arizona State University | 16 | 2,836 | 5,093 |
| USC | 15 | 2,636 | 4,153 |
| UCLA | 28 | 2,375 | 5,202 |
| New York University | 10 | 2,359 | 2,415 |
| UNC | 14 | 2,331 | 4,781 |
| University of Toronto | 11 | 2,273 | 1,861 |
| UC San Diego | 5 | 2,161 | 9,846 |
| MIT | 32 | 2,053 | 3,978 |