Where Do the Top Planning Scholars Come From?

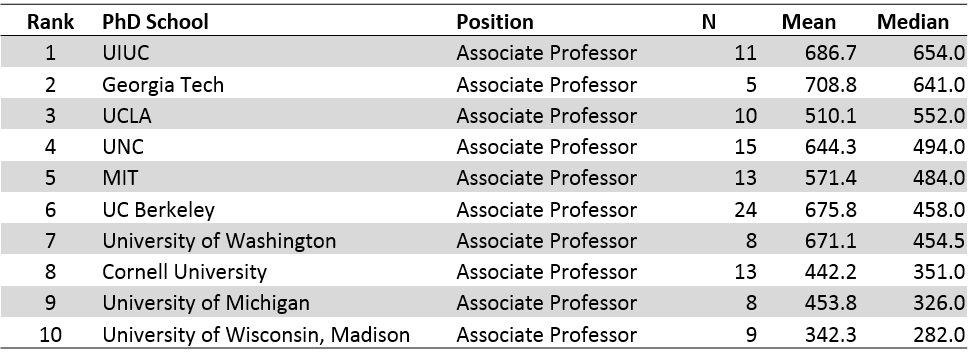
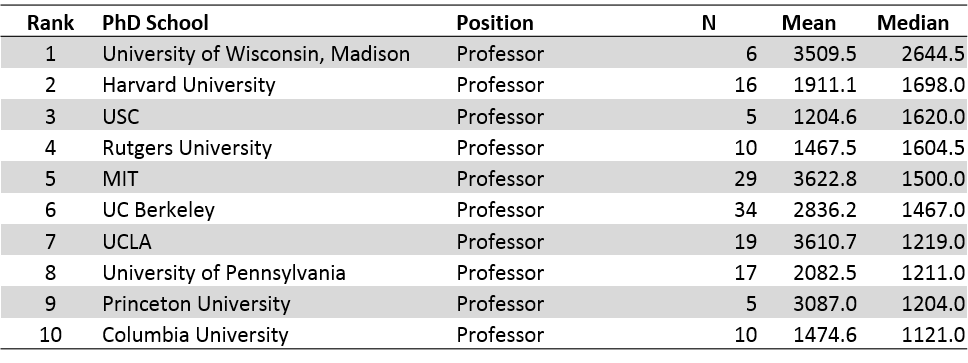
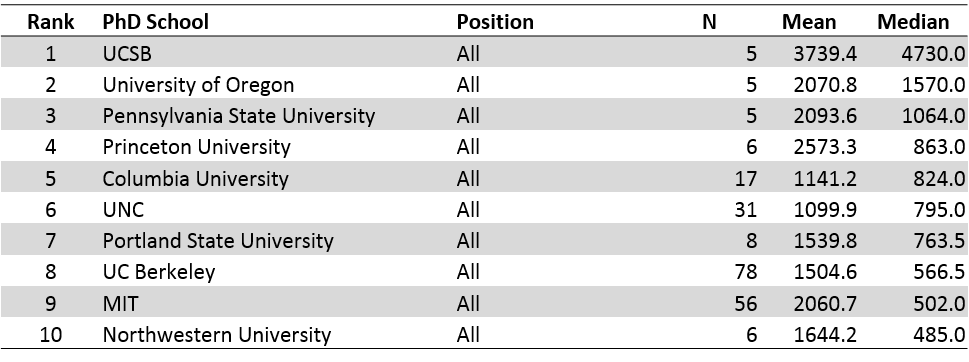
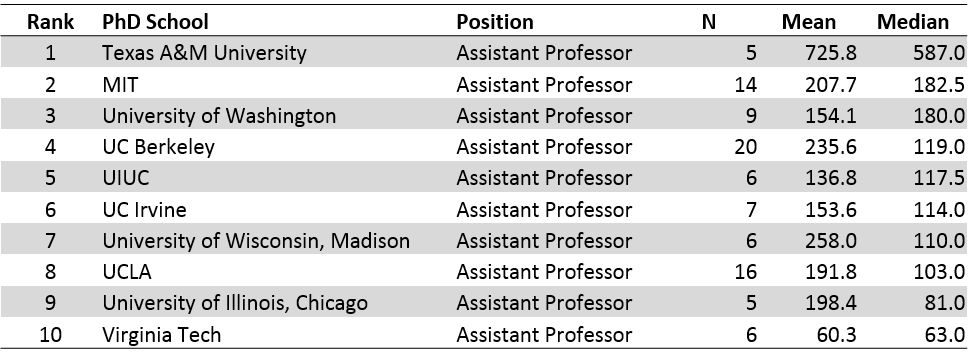
My recent analyses of the 2015 citation data considered the school where urban planning faculty are currently teaching.  In a 2013 Planetizen article, I looked at where planning faculty received their degrees, which showed many of these schools did not have urban planning programs.   The following looks at citation activity by degree granting school and current rank.  For 2015, Texas A&M, UIUC, University of Wisconsin, Madison, and UCSB have the highest median citation rates for Assistant, Associate, Full, and all professors, respectively.  To be included schools needed to have a minimum of five faculty in a category.  See Tables 1 through 4 below for the results.

Table 1.  Assistant Professors

Table1b

Table 2.  Associate Professors

Table2b

Table 3.  Full Professors

Table3b

Table 4.  All Professors

Table4b

Posted in Citation analysis, planning, publications | Leave a comment

Another Way to Slice the Data: Performance by Rank

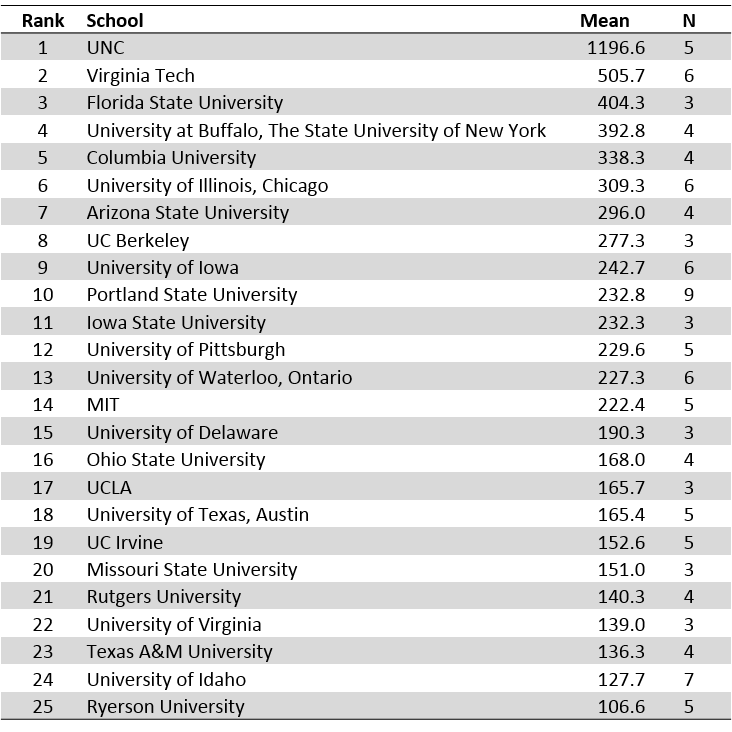
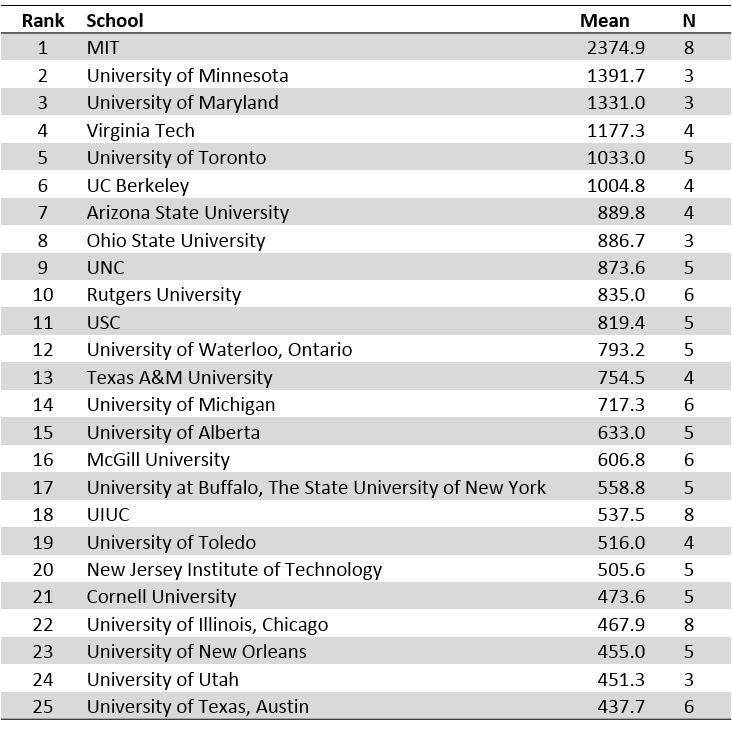
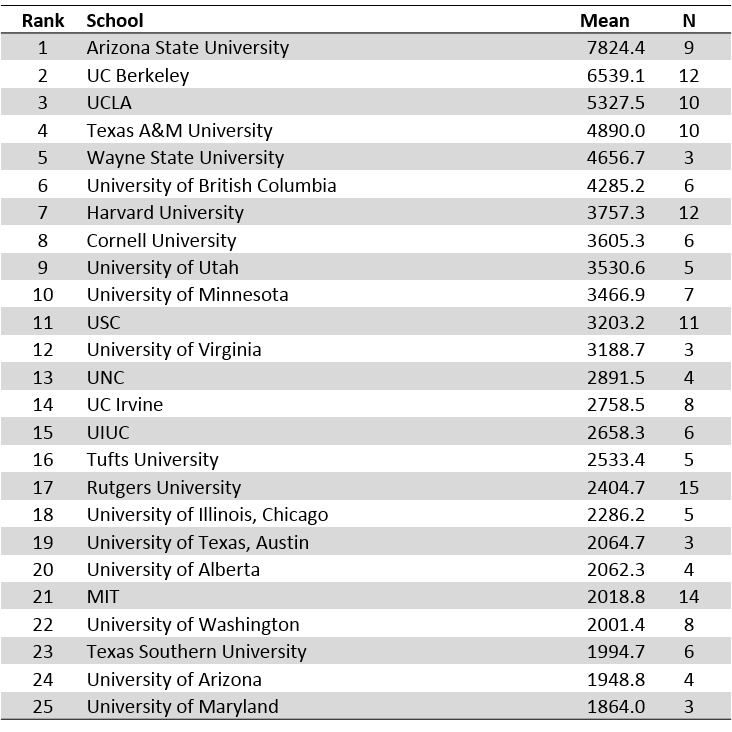
To control for departments with more senior faculty that have higher citation rates, I used the median number of citations for ranking purposes (see 2015 rankings).  As might be expected, there is significant skewness in the data, attributable to a small number of highly cited faculty.  Another way to compare planning departments is to show rankings by position (Assistant, Associate, and Full Professors).  Because planning faculties are relatively small, I excluded schools with less than three faculty at any particular rank, and I also used the mean instead of the median to show central tendency.  The three tables below show these results.

Table 1.  Assistant Professors

Table1a

Table 2.  Associate Professors

Table2a

Table 3.  Full Professors

Table3a

Posted in Citation analysis, planning, publications | Leave a comment

2015 Urban Planning Citation Analysis

The following is a summary of the 2015 citation analysis results for Urban Planning faculty in North America (mostly U.S.). The lists of urban planning departments and faculty were based on the 20th Edition (2014-2015 academic year) Association of Collegiate Schools of Planning (ACSP) Guide to Undergraduate and Graduate Education in Urban and Regional Planning. Results for 2013 and 2014 describe the methodology (click years to see previous analyses). A recent article in the Journal of Planning Education and Research (JPER) provides in-depth background on the objectives and overall approach (go to article).

Table 1 shows the top 25 planning schools based on the median number of Google Scholar citations per faculty member (this includes only departments with a minimum of 5 tenure-track faculty).  Also, see the department rankings by faculty tenure here.

Table 1

Table1

UCLA, Harvard, UC Berkeley, and NYU retain the top 4 spots, with the University of Minnesota moving up from last year to become the fifth most productive planning faculty. New to the top 25 in 2016 are Virginia Tech (19), the University of Pittsburgh (20), University of South Florida (22), and Cornell University (23). These rankings shift slightly from year to year based on changes in faculty rosters (through retirements, new additions, affiliation changes, etc.) ACSP membership, and data adjustments. Additionally, individual faculty citation counts increase each year at varying rates averaging 20-30 percent for tenured faculty (associate and full professors). The total number of citations for current urban planning faculty increased from just under 800,000 in 2014 to over 1,000,000 at the end of 2015. The top 25 cited urban planning faculty are shown in Table 2. The list contains a few changes, most notably the inclusion of Robert Bullard (14), now at Texas Southern University.

Table 2

Table2

The data also point to citation thresholds that emerge for the three ranks (Assistant Professor, Associate Professor, and Full Professor). Figure 1 shows the mean and median values for each rank. The middle range of citations for Assistant Professors is about 70, with nearly 300 for Associate Professors, and just over 900 for Full Professors. This corresponds with median years of experience at 7, 15, and 30 years respectively. There is a significant amount of variation within each rank with years of experience (years since terminal degree was received) explaining only about 6 percent of the variation in individual citation activity. Related to my analysis posted in October 2015, there is no statistical difference in citation activity between female and male urban planning faculty for ACSP member schools.

Figure 1

Picture1

*Note: A tool to query the data for individual faculty and departments will be available soon.

Posted in Citation analysis | 8 Comments

Scholarly Citation Differences Between Male and Female Faculty in U.S. Planning Schools

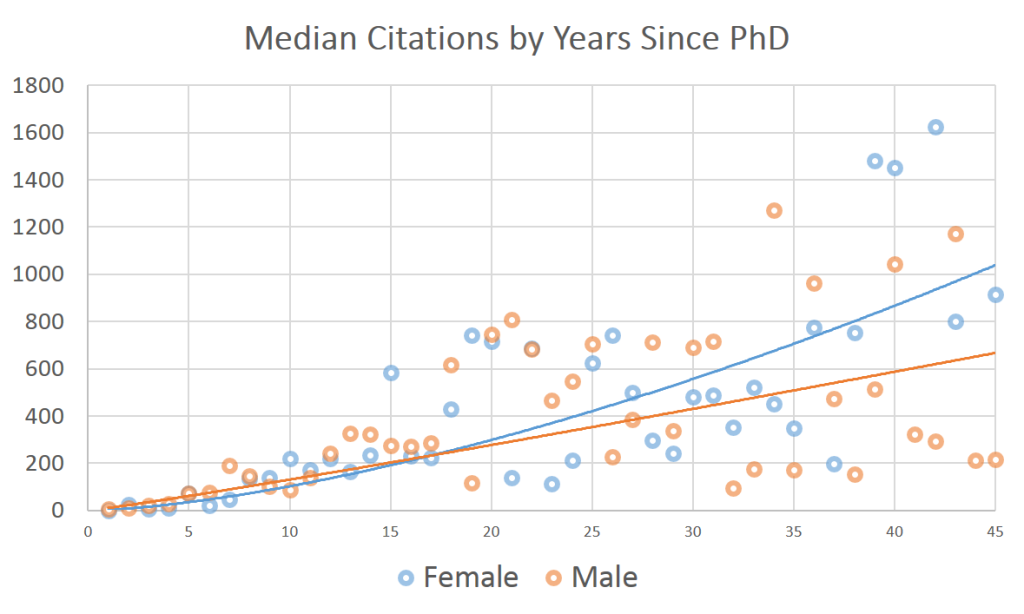
Among urban planning faculty in the U.S, who is cited more – men or women? My previous analyses compared schools, years of service, and academic rank (see 2014 Urban Planning Citation Analysis), and I thought it would be interesting to look at citation totals by gender. Others have examined these differences noting challenges faced by females due to discrimination and time-off for maternity leave (see for example Leahey, 2006; van Arensbergen, van der Weijden, & Van den Besselaar, 2012). Productivity and citation activity can also be impacted by taking on administrative roles, teaching and advising loads, and other appointments that effect the amount of time available for publishing. Unfortunately data about these activities were not available for individual planning faculty in my sample. The table below shows the median number of citations by rank and gender which includes 291 females and 623 males.

Median Number of Citations by Rank and Gender

Picture1
Source: Google Scholar

The table shows that there are proportionally larger differences between males and females at the assistant and full professor ranks with slightly less difference for associate professors. However, a statistical test of median values comparing gender and rank suggests there is no significant difference (at 90% confidence level).

Picture2

So who is cited more?  There appears to be no difference.

References

Leahey, E. (2006). Gender differences in productivity research specialization as a missing link. Gender & Society, 20(6), 754-780.

van Arensbergen, P., van der Weijden, I., & Van den Besselaar, P. (2012). Gender differences in scientific productivity: a persisting phenomenon? Scientometrics, 93(3), 857-868.

Posted in Citation analysis | 1 Comment

Highway Trust Fund Running Out

WASHINGTON, DC (localmemphis.com)

Authorization for the federal transportation Highway Trust Fund is set to expire July 31st.  It’s the 34th time in six years that congress has faced this dilemma. If congress does not act… Federal funds for transportation projects will disappear.

Capture

Posted in Uncategorized | Leave a comment

TechniCity Enrolls Students from Around the World

TechniCity, the MOOC about cities and technology taught by UAP Professor Tom Sanchez and Ohio State University Professor Jennifer Evans-Cowley, enrolled 9,355 students from 154 countries.  Nearly 40% of students enrolled are from emerging economies around the world. The following summarize characteristics of students enrolled in the course.

Capture1

Capture2

Capture3

Capture4

Posted in MOOCs | Tagged , | 1 Comment

Seattle Public Transit Reacts To Income Inequality

This weekend, the Seattle metro area launched an initiative to address income inequality through public transit. People in low-income households can now ride buses, trains and ferries at reduced fares.

The initiative is among the first of its kind in the U.S., and transit experts across the country are watching closely. Thomas Sanchez, a professor of urban affairs and planning at Virginia Tech, discusses the initiative with Here & Now’s Jeremy Hobson.

http://hereandnow.wbur.org/2015/03/02/seattle-public-transit-low-income

Posted in equity | Tagged | Leave a comment

Excellent TechniCity 2014 Student Projects

The following are the top 20+ student projects as selected by the TechniCity instructors.  There were many, many great projects overall!  Click on the title to read more about the project.  See the 2013 projects here.

Author(s) Project
Agnieszka Szczepańska Biking in Warsaw
Alessandra Manganelli, Brian Channel, Tal Ashkenazi Enhancing, sharing, and protecting urban green spaces
J. Álvarez-Vidales, M.J. Perea-Medina, and A. Cerezo-Medina Tourist flows management in Málaga
Brittany Kubinski Intersection safety
Dani Ne’eman Improving traffic light effectiveness
Dursun Yildirim Bayar Augmented reality for urban tourism
Eartha Barclay Community action app
Eric Gould Bike lane lighting
Giulia Volla Platform for community engagement
Giuseppe Lassandro Private bicycle mobility
Janos Katona and Ilaria Meggetto Green Urban Landscape Proximity Index
Jessica Hyegyung Kim Engage with your city park
Kanika Sharma “Raise the Issue” App
Marques Anderson Piezoelectric flooring
Mhd Amer Al Zeiback The World Heritage City of Damascus
Miao Zhou “Hail a Taxi in Beijing” app
Michalina Gamification and energy use
Neelakshi Joshi SuperForager: edibles app
Samantha Jones SuperForager: edibles app
Yari Sanfelice Flood monitoring in Florence, Italy
Ashley Carpenter Free Columbus Project
Jerry Huang Smart district energy
Kurt Allebach Augmented reality for situational awareness
Magali Rombola Citizen data collection app
Posted in Uncategorized | Tagged | Leave a comment

Are U.S. Planning Programs “Diverse”? (Part II)

My previous blog post discussed the racial and ethnic diversity of graduate students in U.S. urban planning programs (see Are U.S. Planning Programs “Diverse”?). I received some very insightful feedback, mostly supporting the idea that we need to better define what “diversity” means if planning academics and planning professionals consider this a priority. I wasn’t accusing PAB of intentionally focusing on “whiteness” in their description of “student diversity,” rather, I was pointing out how diversity ends up being perceived relative to the racial/ethnic categories that are used to report student and faculty composition. The fact of the matter is that skin color dominates the “diversity” conversation.

The second part of my descriptive analysis of program racial/ethnic diversity focuses on faculty, as well as a comparison of faculty to students. It’s no surprise that faculty members of urban planning programs are predominantly white. Data from PAB’s Annual Report Online Database (AROD) show the breakdown of full-time, part-time, and adjunct faculty for planning programs.[1] Out of 1,806 total faculty, nearly 80% are white. This figure is composed of 71% white full-time faculty, 77% white part-time faculty, and 85% white adjunct faculty. Figure 1 illustrates a stark gender imbalance as well as the large numbers of white adjuncts hired by planning programs. The predominance of white adjuncts may be a reflection of the planning profession (i.e., the available pool) or who we choose to hire. While the proportions of white full-time faculty and graduate planning students are quite close (71% and 70% respectively), the gap widens with respect to part-time and adjunct faculty.

Figure 1

Figure1a

Figure 2 shows a relatively flat distribution with about half of planning programs having 80% or greater white faculty members and less than one-fifth having under 70% white faculty members.

Figure 2

Figure2a

Comparing program proportions of white faculty and students shows a significant positive correlation between the two groups (see Figure 3). It would be interesting to assess the role of recruiting resources and other institutional factors that may be influencing this relationship. It would also be interesting to see how/if this relationship has changed over time.

Figure 3

Figure3a

As shown in the post on student racial and ethnic diversity, I also looked at the numbers of race/ethnicity categories represented by planning program faculty members. This is a crude measure of variation because it doesn’t account for the evenness of numbers between categories, however, it is used here for illustrative purposes. The numbers of categories are slightly different for the faculty data from the AROD and the data from the ACSP Guide. The AROD includes 9 race categories for faculty:

  • White
  • Black or African American
  • American Indian or Alaska Native
  • Asian
  • Native Hawaiian and Other Pacific Islander
  • Some Other Race Alone
  • Two or More Races
  • Unknown
  • Foreign

The ACSP Guide includes 8 race/ethnicity categories for students:

  • Hispanics of Any Race
  • White
  • African American
  • Native American/Pacific Islander
  • Asian American
  • Mixed
  • Other/Don’t Know
  • Non-US Citizens

Figure 4 shows the relationship between the numbers of faculty and student categories represented by planning programs. Similar to Figure 3 there is an observable positive correlation between the numbers of groups represented by planning faculty and the students within programs. The upper right-hand corner highlights 13 “diverse” programs that have at least 5 groups represented by both faculty and students. Table 1 shows the list of these schools.

Figure 4

Figure4a

Table 1 – Racial/Ethnic categories represented by faculty and students

Table1a

Your comments are appreciated.

[1] I combined these data with data from the ACSP Guide used in the student analysis. This resulted in complete data for 65 U.S. planning programs.

Posted in diversity | Tagged | 1 Comment

Are U.S. Planning Programs “Diverse”?

For some time the planning profession and planning educators have shown concern about being too “white”. Our country continues to experience significant demographic changes, especially in terms of race and ethnicity, most notably becoming less “white”. The Planning Accreditation Board (PAB) has emphasized that planning programs should be racially diverse, which translates into being less “white” and/or more “non-white” – for the purposes of better representing the populations we serve. Regarding student diversity PAB language states:

“Student diversity: The Program shall adopt appropriate recruitment and retention strategies, including curricular strategies, to achieve its aspirations for a diverse student body, and shall document actual progress in implementing those strategies. The Program shall foster a climate of inclusivity that appreciates and celebrates cultural difference through its recruitment and retention of students. Students shall possess, in the aggregate, characteristics of diversity (e.g., racial and ethnic background) that reflect the practice settings where graduates work or where professional needs exist in the Program’s region of recruitment and placement. Notwithstanding, the demographic mix is not a static concept, and all planning programs should seek to be in the forefront of a diverse society.”

It can be argued that “racial and ethnic background” is a very narrow indicator of student diversity and should be reconsidered in light of the broader concept of diversity. Why don’t we include sexual orientation, political perspectives, socio-economic background, musical tastes, etc? Fostering inclusion involves self-identification which may be seen by some as potential for discrimination. As planning programs consider their relative student diversity (by PAB criteria), I thought it would be interesting to look at program-level metrics on race and ethnicity. According to PAB, of the nearly 5,000 students in accredited programs, 69.5% (full and part-time) are non-Hispanic white, which compares to 62.6% for the U.S.[1] In addition, these programs are 53% male and 47% female. So planning programs have some work to do. The aggregate numbers tell part of the story, and the question then becomes whether the unit of analysis is the discipline or individual programs.

Using the assumption that many programs draw from within and supply planners to their own states, I compared each program with the corresponding percentage of white residents in their state. Analyzing the race and ethnicity data for graduate students of ACSP member schools using the Guide to Undergraduate and Graduate Education in Planning (20th Edition). I selected the 96 member schools in the U.S. of which 84 provided complete data. This is admittedly a simplistic approach, however, I think it provides context for further discussion about program-level diversity. There is also the question whether the benchmark should be race-ethnicity at the national, state, regional, or workforce scale.

Figure 1 shows the weak correlation between state % white and program % white and Figure 2 shows the distribution of variance between state % white and program % white for the 84 programs included.

Figure 1

Figure1

Figure 2

Figure2

As mentioned, program demographics (% white only) is weakly correlated with state demographics (see Figure 1). This is because planning programs differ in the number of out of state students (including international students) enrolled, even for programs within the same state. Also evident are outliers like Historically Black Colleges and Universities (HBCUs) such as Alabama A&M, Texas Southern, and Jackson State; states with high proportions of white residents like Utah, Iowa, and Maine; and elite schools like Harvard, MIT, and Penn. The “orange zone” shown in Figure 2 includes planning programs with proportions of white students that vary from their state proportions by 30% or more. Based on “whiteness” these programs qualify as hyper-diverse. The results for this group are driven by having much lower percentages of white students compared to their state averages. Whether these 19 schools represent diversity is open to interpretation (see Table 1).

Table 1 – Orange zone programs

Table1

On the other hand, schools that fall into the “green zone” shown in Figure 2 are those within 10% absolute difference from their state proportion of white residents. These include the 23 schools shown in Table 2. It should be mentioned that the 30% and 10% thresholds were selected arbitrarily for illustrative purposes and aren’t related to any particular standards. In addition, based on the available data, only 5 of the 84 schools included had margins greater than 10% above their state averages (see Table 3).

Table 2 Green zone programs

Table2

Table 3 Below state level

Table3

The metrics are an obvious problem here. An appropriate measure would take into account representation across identified groups. Two schools, UCLA and UC Berkeley have students that represent all 8 categories used for reporting student race/ethnicity. Eight other schools represent 7 of the 8 categories. Overall, 56 of the 84 schools represent 4 of the 8 categories (see Figure 3). I’m not recommending this as a diversity measure, but instead using it for descriptive purposes.

Figure 3

Figure3

In addition, a pressing issue that will be discussed in a follow-up blog post is planning faculty diversity. Data from the ACSP Guide show significant disparities with two-thirds of faculty being male and over 80% being white. This is the product of different dynamics that are being faced by institutions that will require concerted efforts to remedy.

Your comments are welcome.

[1] Source: U.S. Bureau of the Census, County Population Estimates by Demographic Characteristics – Age, Sex, Race, and Hispanic Origin; updated annually for states and counties. http://www.census.gov/popest/counties/asrh/. 2010 Census of Population and Housing for places; updated every 10 years. http://factfinder2.census.gov.

Posted in diversity | Tagged | Leave a comment